Pulse is an AMCHP bi-monthly newsletter featuring a curated selection of insightful, story-driven articles and perspectives centered on critical topics in maternal and child health (MCH). Each edition showcases a collection of contributions authored by AMCHP’s subject matter experts, partners, and collaborators, including families and individuals with lived experience with the challenges AMCHP endeavors to solve.
This newsletter includes a special segment called Pulse Plus, which features articles on various MCH issues and topics relevant to our members and the broader MCH community.
Are you an AMCHP member or partner interested in collaborating on an article for Pulse? Please e-mail us at communications@amchp.org.

Sharing Successes from AMCHP’s First Policy Replication Project
In 2024, AMCHP launched its first-ever Policy Replication Project that focused on supporting an organization to replicate a policy from the MCH Innovations Database. Michigan’s State of Birth Justice was selected to replicate Colorado’s Momnibus Bill Package, championed and developed by the advocacy organization Elephant Circle. Their Replication Project focused on adapting Elephant Circle’s policy implementation approach to fit the Michigan context. Nicole White, the Director of the Michigan State of Birth Justice and Co-founder of Birth Detroit, shares about their experience participating in the Replication Project Policy Pilot.

Replication Success Story: Indiana Department of Health and Up for Learning Facilitation of Getting to Y
Up for Learning’s Getting to Y’s goal is to bring meaning to the Youth Risk Behavior Survey and include youth voices in how they analyze public health data. Through the Getting to Y program, the aim is to increase adult mentorship and decrease bullying for Hoosier youth. This program is designed to promote adult-youth partnerships. Having effective adult leaders in the community, school, and personal life of these young people will encourage positive youth influence on the youth participating in the program.

Georgia Department of Public Health: Youth Advisory Council Sparks Youth Leadership
Ace’s journey illustrates the powerful impact of the Georgia Youth Advisory Council in transforming youth from hesitant patients into confident self-advocates. Through the S.T.E.P.S. framework – Start Early, Talk, Educate, Plan/Prepare and Practice, Speak Up & build Support – Ace learned critical health care transition skills that enabled him to manage his asthma effectively. His experience reflects the council’s mission to empower young people, fostering leadership and communication skills while addressing the challenges faced during the transition to adult care. The group, now known as Georgia Youth Healthcare Leaders (GYHL), aims to create a healthier future by connecting, advocating, educating, and leading peers. Through their contributions, council members not only improved their own health management but also engaged in broader public health efforts, raising awareness and advocating for policies that impact youth health care.

Transition from Pediatric to Adult Health Care: AMCHP Innovation Got Transition Replication Project – Idaho Title V MCH Program
By Angela Lindig, Executive Director, Idaho Parents Unlimited (IPUL), Family to Family Health Information Center This project helps families of youth with special health care needs (YSHCN) by providing structured tools to guide the transition from pediatric to...

Enhancing Maternal and Child Health Knowledge: New Educational Resources on Rheumatic Heart Disease and Group A and Group B Strep Infections
By Justin Huang, Senior Analyst, Policy Impact, Association of Maternal & Child Health Programs (AMCHP); Kirstie Perrotta, MPH, Teratogen Information Specialist, MotherToBaby California; and Lorrie Harris-Sagaribay, MPH, Teratogen Information Specialist,...
A Perspective from Attending this Year’s Annual Conference from North Carolina’s Title V State Family Leader
My name is Mahala Turner, and I am the NC Title V State Family Leader. I attended AMCHP’s 2024 Conference, “Partnering with a Purpose,” to celebrate my role of being a family leader for one year. My Experience Living with a Child with Special Health Care Needs...
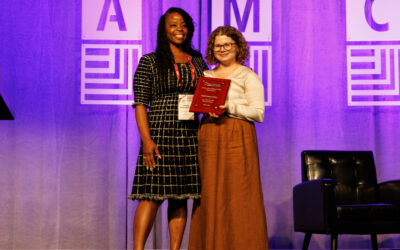
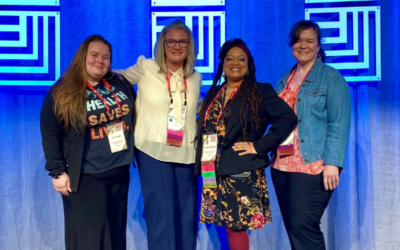
Representing BirthMatters at the 2024 AMCHP Annual Conference: Feeling the Pride of Partnership with AMCHP
By Amber Pendergraph-Leak, CD(DONA), CLC, CHW, CMA, Executive Director, BirthMatters, and recipient of this year’s Innovation Hub Partnership Award About BirthMatters Hello! I am Amber Pendergraph-Leak, the Executive Director of BirthMatters, a South Carolina...
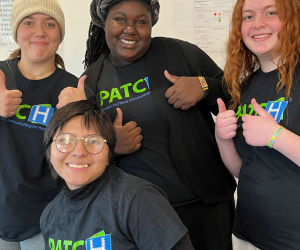
Denver Health Pediatrics at Denver Public Schools Uses the PATCH (Providers and Teens Communicating for Health) Program to Improve Adolescent Health Care
By Tara Melinkovich, MPH, Youth Engagement Program Manager, Denver Health Pediatrics at Denver Public Schools Introduction Adolescence is a time of major change. Teens often feel awkward as they navigate the physical and emotional changes occurring between...

Puerto Rico’s Title V Health Needs Assessment: Facing the Challenges Head On
By Marianne Cruz-Carrión, MS and Norma Boujouen Ramírez, PhD, Puerto Rico Department of Health Introduction The Puerto Rico Title V program’s interdisciplinary team has members from the health, social sciences, and behavioral health fields. The team took a...
The HOPE (Honor Opportunity Purpose Excellence) Alternative Learning Program: A Replication Success Story
Enhancing Mental Health Support in Schools Lauren’s Journey: A Teacher’s Transformation Lauren was a teacher in her mid-forties working in an alternative school in North Carolina. Her commitment to her students—especially those with complex mental health needs—was...

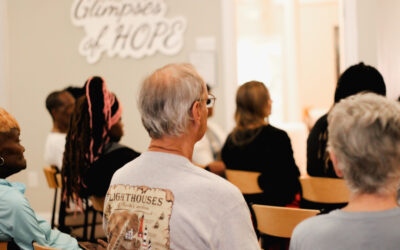
Building Resilience through Intervention: Growing Healthier Together (BRIGHT) in a Recovery-Affirming Prenatal Care Setting
By Caitlin Clark, MSW LICSW, Clinical Program Manager, Boston Medical Center: Project RESPECT (Recovery, Empowerment, Social Services, Prenatal Care, Education, Community and Treatment) Sitting in the prenatal exam room at 28 weeks pregnant, Casey reflects on...

A Message from our CEO, Terrance E. Moore
Greetings! I am still reflecting on all we accomplished at AMCHP’s 2023 Annual Conference, Cultivating Diverse Leaders in Maternal and Child Health. I feel energized, and my expectations were exceeded by participating and observing the information exchange,...

Steps Toward “Father-Friendly” Maternal and Child Health (MCH) Programming: Grief Support for Fathers in the World of MCH
By Candice J.T. Simon, MPH, Program Manager, Workforce Development and Capacity Building, Association of Maternal & Child Health Programs (AMCHP) Introduction Few resources are available to help fathers cope with losing a child or partner during childbirth. Even...

Maine’s Virtual Dental Home Initiative Expands Access to Care
By Becca Matusovich, Executive Director, Children’s Oral Health Network (COHN), and Emilie Knight, Virtual Dental Home Program Coordinator, COHN Background At a recent Virtual Dental Home (VDH) site visit, a group of stakeholders met to learn about and observe the...

The 2023 Perinatal Behavioral Health Policy Landscape
By Jessica Simon, Program Manager, Health Systems Transformation, Association of Maternal & Child Health Programs (AMCHP) Introduction The most recent Substance Abuse and Mental Health Services Administration data indicates that approximately one in three people...